Logging errors in Microsoft Flow with Application Insights
Table of contents:
This post extends what I wrote in a previous one about Try-Catch pattern in Microsoft Flow. In this writing I am focusing on how you can log errors that occurs in your Microsoft Flows in a single place, using Azure Application Insights.
Watch here how the whole solution works in my demo:
Setting up Application Insights
Microsoft Docs describe the service as an extensible Application Performance Management (APM) service for web developers on multiple platforms. Use it to monitor your live web application. It will automatically detect performance anomalies. It includes powerful analytics tools to help you diagnose issues and to understand what users actually do with your app. It’s designed to help you continuously improve performance and usability.
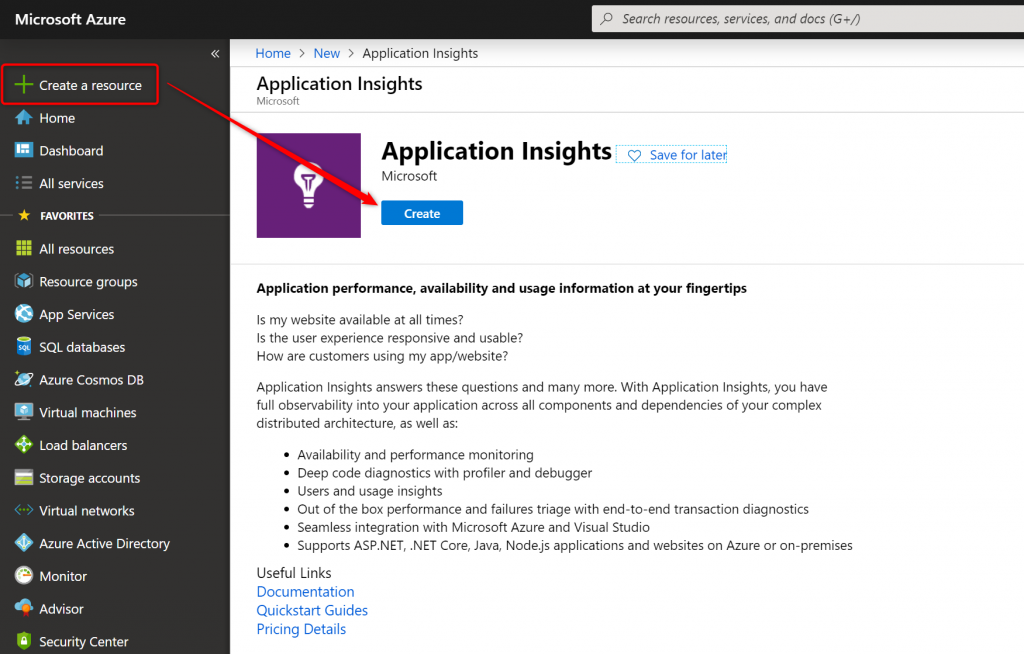
To create your own service, simply type “Application Insights” in “Create a resource” and when found – click “Create”.
Once you have it created, remember to copy the Instrumentation Key – it is required to authorize calls to service:

Now you’re ready to start with building your own logging solution.
Important! As of today Application Insights service does not own any APIs, that would allow us to call it directly from Flow. It although has a wide range of SDK: .NET, Node.JS, Java EE and more and therefore it is possible to call it using custom functions.
Azure Function
As I mentioned above: Application Insights has no API, but has SDK. Therefore to call it from Flow, we need to actually to create an Azure Function that will act as a proxy between Flow and the service.
I wrote my function in Node.JS. I did it directly in Azure Portal, following documentation from here: https://github.com/Microsoft/ApplicationInsights-node.js/ and here: https://docs.microsoft.com/en-us/azure/azure-monitor/app/nodejs.
In the beginning of the file you need to define required packages (this is the App Insights SDK from npm) and then provide the Instrumentation Key I mentioned before:
const appInsights = require("applicationinsights");
appInsights.setup(process.env["InsightsKey"]);
const client = appInsights.defaultClient;
Now, depending on your specific requirements, create a function called directly via HTTP request or by the Azure Queue. Whichever way you go, adding new event to the Application Insights log registry is as simple as:
function RegisterFlowError (contents) {
    try {
        var propertiesData = JSON.parse(contents);
        var error = new FlowError(propertiesData["Correlation Id"]);
        error.Source = "Error in Flow";

        client.trackException({ exception: new Error("Error in Flow"), properties: propertiesData });
    }
    catch (e) {
        return false;
    }
    return true;
}
In my case function is triggered by http request. In its body there is an JSON array of tracked properties (propertiesData) about the exception. The above function is taking the data and creates new entry in Application Insights.
Of course there are other types of tracked properties, apart from exceptions: https://docs.microsoft.com/en-us/azure/azure-monitor/app/nodejs#telemetryclient-api.
Logging errors in Microsoft Flow with Application Insights
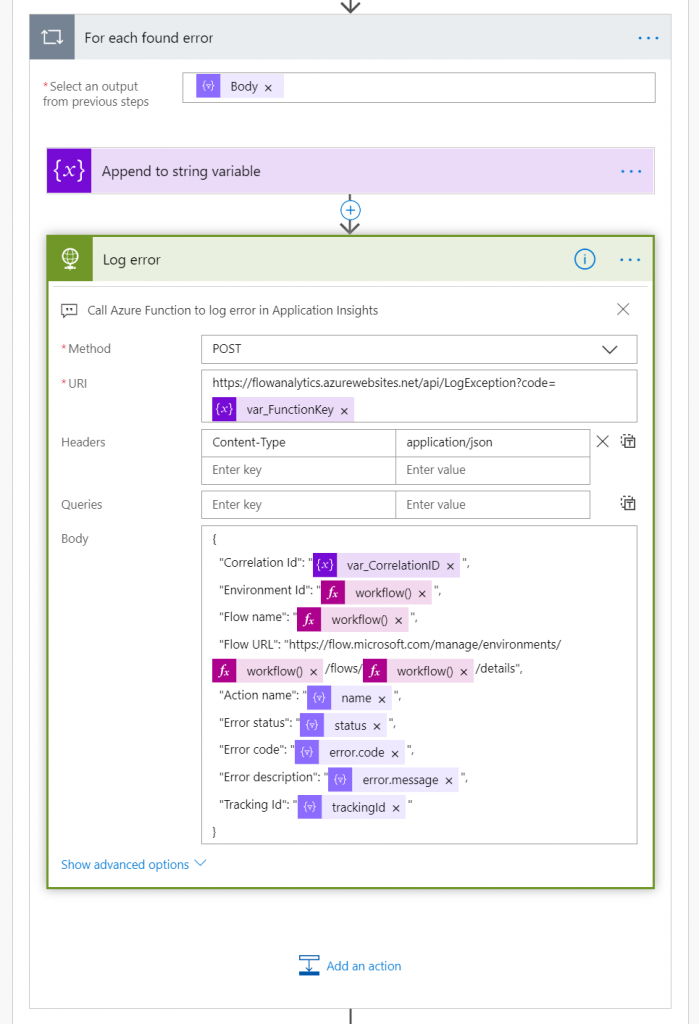
I am doing that by simply calling my Azure Function using http request action, in a “Catch” block of the “Try-Catch” pattern described here, for each found, failed action:
Reviewing logs in Application Insights
Important! It takes up to 5 minutes for an error to be registered and visible in the log.
To review all the caught errors, simply go to Application Insights search console and open one of the entries:
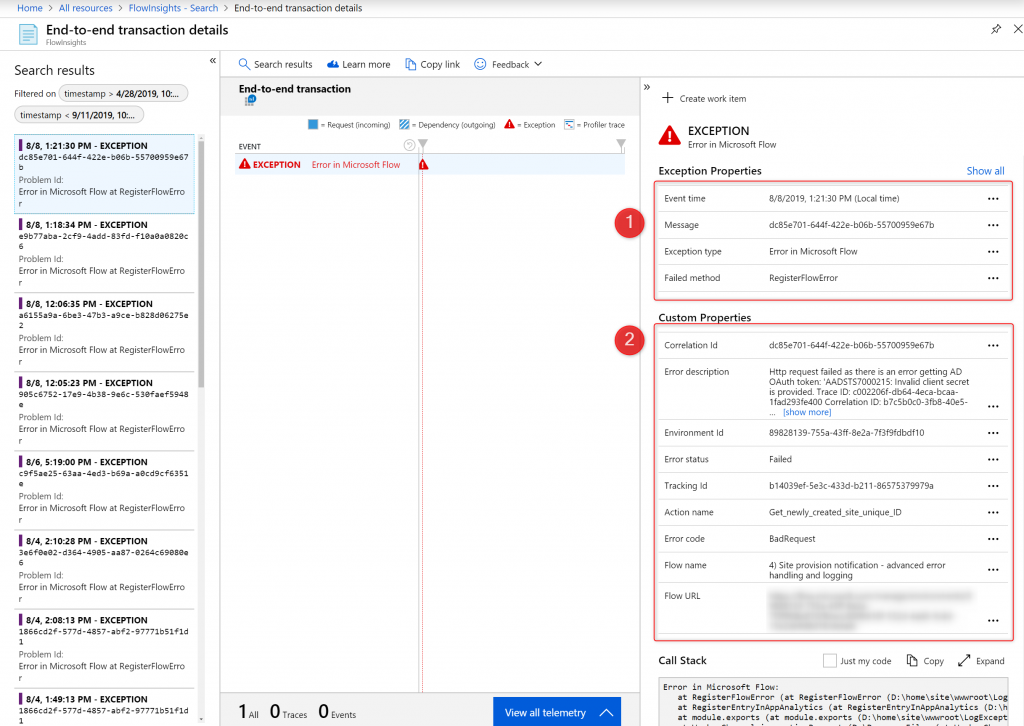
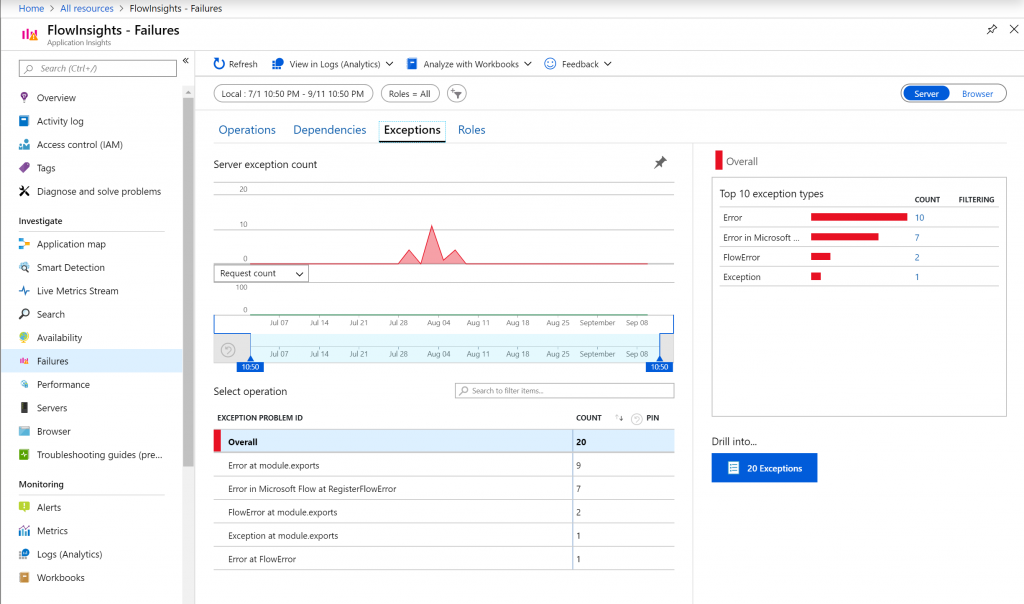
In my case – each entry contains default information (Exception Properties) and a set of Custom Properties passed to log from Flow. In case of monitoring Exceptions, you can as well open “Failures” page to review issues over the time:
Where else can I monitor errors?
If you’re not a kind of a developer person, you can still access two services coming OOB with Power Platform, where you can check how your Flows are performing:
Flow analytics
Dashboard with analysis of a specific Flow. Access it by clicking icon “Analytics” on a flow’s details page:

It gives you an overview of all runs from up to 30 days as well as deep dive into errors, actions, reasons:
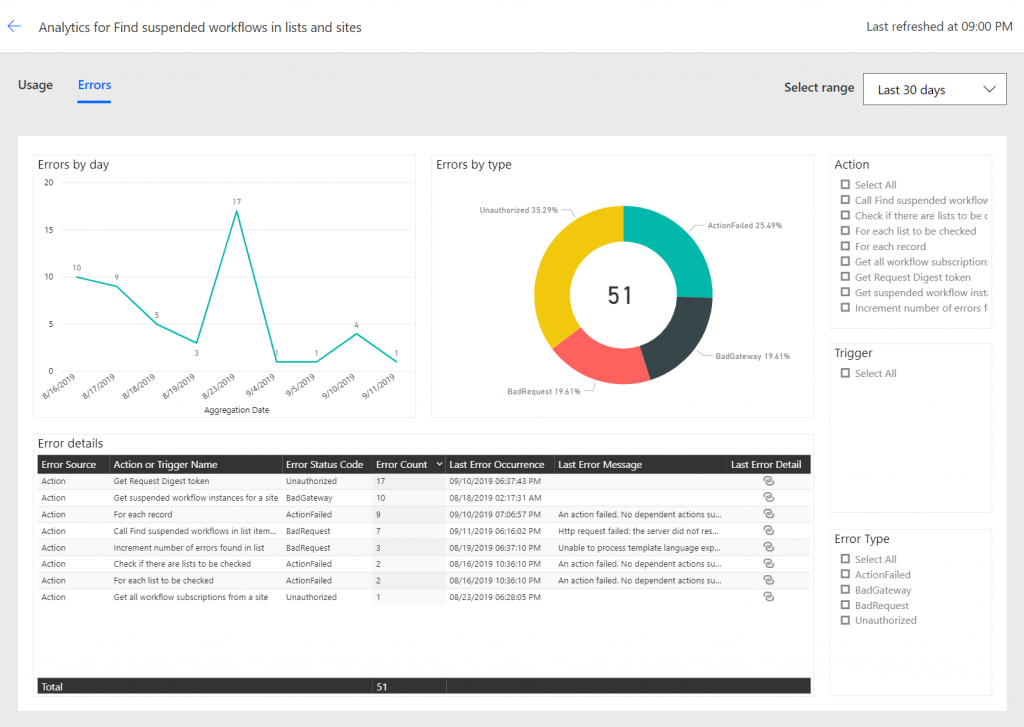
Quite nice, however only from last 30 days and refreshed once/ twice a day.
PowerPlatform Admin Center
This is the second place. It is still in preview, accessible via URL: https://admin.powerplatform.microsoft.com/analytics/. Delivers a big picture about your platform’s health and performance. One of the analytics available for Flow are “Errors”:
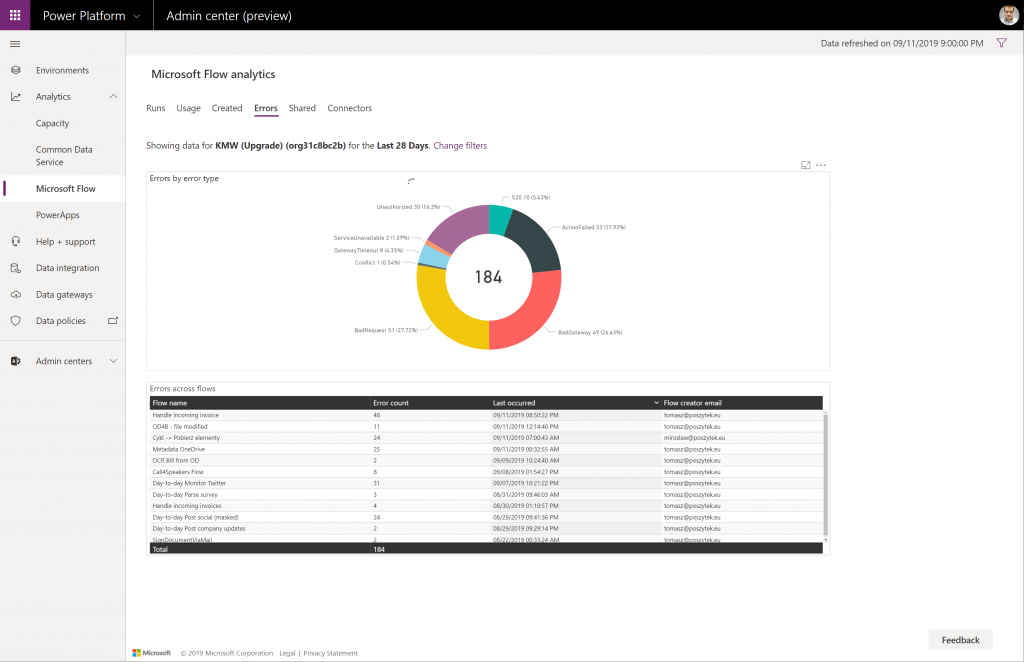
However as with the specific Flow’s analytics – updated up to 2 times per day, only for last 28 days, no specific details – it just tells you that something might be wrong, but still it requires that you check in source what is wrong.
Thank you for reaching this far! I hope you got inspired by reading this post. If you have any questions or you’d like my support don’t hesitate to leave me a comment or send me an e-mail.

